Glean important data from heat mapping in your marketing strategy.
All About Heat Mapping in Marketing
How can you tell if people are interacting with your website pages?
Do you know if they are scrolling all the way down a page, or if they are stopping at the halfway point?
Which other pages are people navigating to when they are on your website?
And finally, what if there was a way to answer all these questions with a single process?
The process is known as heat mapping, and in marketing you can use it to learn more about your website visitors – and make decisions based on that knowledge.
Let’s look at what heat mapping is and how it can benefit your marketing initiatives.
What is Heat Mapping in Marketing?
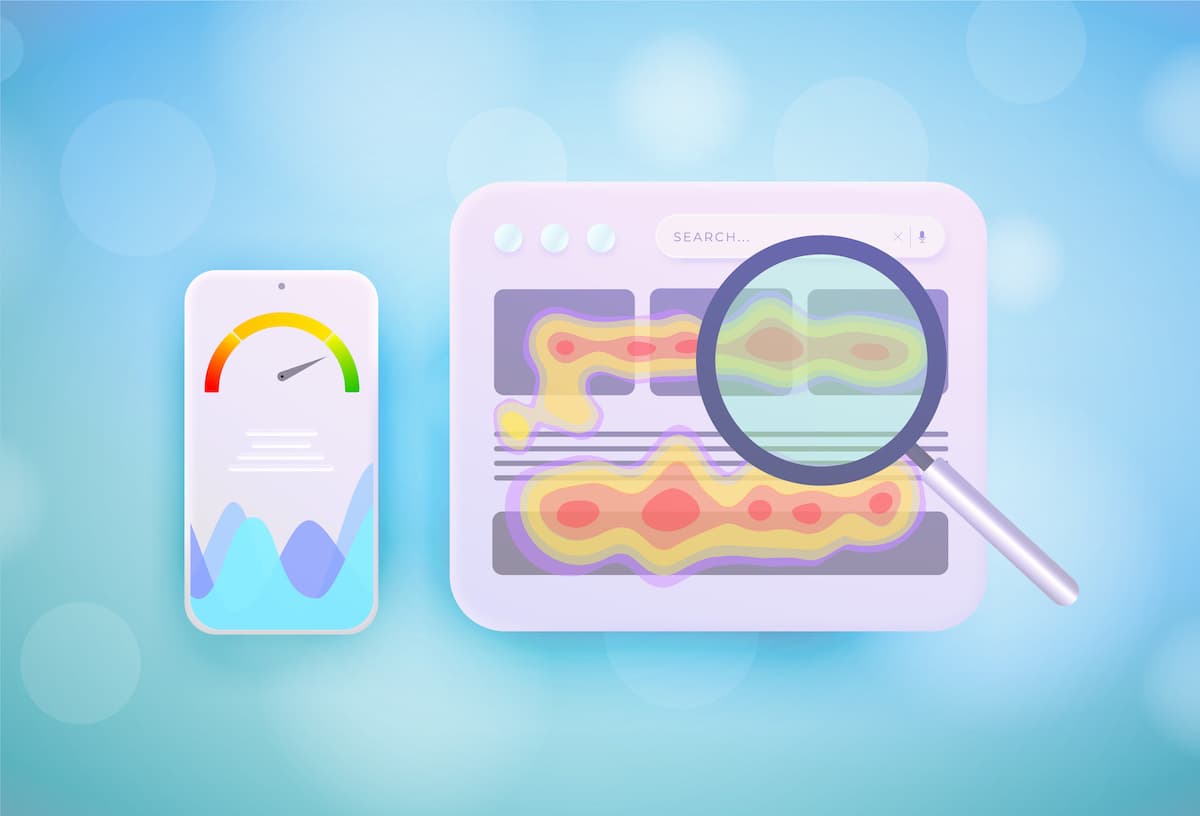
Heat mapping is a process that measures the amount of activity on website pages. Using a color spectrum ranging from warm to cool, a heat mapping tool indicates which areas of a web page receive the most attention from users. In marketing, a heat map is helpful for detecting where any barriers to conversion exist, so businesses can make changes to the page.
Heat maps closely resemble temperature maps seen on weather forecasts, which show ranges of temperature from very cold to very hot. In the case of heat mapping in marketing, the warmer areas indicate the highest activity.
Heat Maps Reveal Beneficial Information for Marketers
While there are certainly several other tools that can help you understand website analytics, heat mapping is a highly visual tool that is easy to understand at-a-glance. It can be shared with clients or your team to communicate areas of strength and weakness. Even better, heat maps can be leveraged for critical decisions on user experience and user interface, and other website improvements.
Here are a few key areas where this process shines:
Scroll Data
When you want to know how far users are scrolling on your pages, you can find the data with heat mapping software. Typically, these tools will show you separate scroll data for desktop and mobile visitors, making it even easier to pinpoint where interest drops off – and which information is getting less visibility.
Click Data
If you want to know which items are generating the most clicks from your visitors, then enlist a heat map for this marketing metric. Look for areas of red on your call-to-action buttons or links for the most popular choices. Even more interesting, you can see areas people are trying to click, such as images or text, that you may want to consider linking to further information.
Navigation Data
Heat mapping is also beneficial in showing you where users are navigating to, from your page. For example, if they land on your home page, are the majority visiting your about us page or your services page? Getting this information can help you better understand the journeys of your visitors and adapt page content based on that.
Visual Data
One of the main benefits of heat mapping in marketing is the opportunity to present website visitor interactions in a completely visual way. This can help clients and teams draw conclusions and make decisions on user experience much faster than wading through pages of numbers that may not be able to interpret.
Learn How to Translate User Data into Actionable Improvements
Heat mapping is but one method of gathering and analyzing user data. For more ways to apply data analytics and principles into your business, check out our Web Analytics Consulting. We'll introduce you to key concepts in data analytics, data visualization, and data science methodologies to help you drive better business decisions.

