Read & Speak the Language of Analytics
When running a website, being able to figure out where your traffic is coming from and what it's doing once it reaches your site is critical. Because of this glaring necessity, Google Analytics is arguably one of the best things that's ever happened to webmasters, but it can also be an information overload to the uninitiated. Even those who have been using the tool for a long time often discover a new feature or a new way to take advantage of an existing one.
If you’re going to start using any version of web analytics, be it paid or free, learning the lingo is a good foundation to build upon. Once you learn some of the basics, the intuitiveness of many of these platforms, especially Google Analytics, will allow you to track and influence your site’s traffic and significantly increase its value.
Common Terms
Understanding some common terms in analytics is essential. For instance, "bounce rate" is a term that is thrown around frequently. The bounce rate is simply the ratio of people who visit your site and leave after seeing one page compared to the total number of visitors. "Unique visitors" is another term that is used often. This is a term that simply refers to individuals who come to your site for the first time. Also, learn your acronyms! Terms like CPA (cost per action), CPC (cost per click), and CTR (click through rate) are some of the most commonly referred to, and most important metrics within web analytics.
Identify Where Revenue Comes From
One of the nice things about using web analytics is that you can actually see exactly where your revenue is coming from by identifying which traffic sources produce the most sales or conversions. For instance, if people that get to your site from the search engines convert at a much higher rate than those who get there from advertising, you'll know which visitors you want more of on your site. Additionally, you can create custom channels to segment the data even further. Find out which traffic sources are being used by people who have already been to your site, and which are being used by first time visitors.
Broaden Your View
Try to use a holistic approach to examining your website traffic. These means focusing on several key parameters in order to get a comprehensive idea of what is happening. Most people who use analytics focus on just one piece of data, like the overall number of visitors, or the keyword that is sending the most traffic, or with the highest conversion rate. These can only give you a skewed view of what's happening. It's just as important to focus on time on site and many other factors that aren't always immediately obvious.
Use Calculated Metrics
When examining the traffic from your website, you need to use calculated metrics as much as possible. For example, using the ROI or return on investment metric will help you see exactly what you are getting out of the dollars that you're investing in your site.
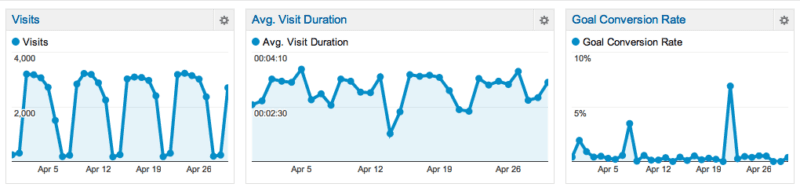
Get Visual
Another attractive feature of using analytics software is that it allows you to convert the data into graph mode. When you see things on a graph, they are much easier to visualize, especially historically. This allows you to figure out where trends are occurring and what is really happening on your site. Since numbers can only go so far to give you an idea of what is going on, using graph mode is the best way to get a bird's eye view of what's really happening on your site - the image at the top of the post being a great example of this.